


👋 Hi, this is P.Y., I work as an Android Staff Engineer at Block, the non-fungible company formerly known as Square. I spend a lot of time focusing on performance and try to share my experience with deep-dive blog posts. I hope you like this one, let me know on Twitter!
Summary
This blog shows how to see what the main thread is doing in Perfetto traces by leveraging a seldom-used Looper logger API.
Profiling with Perfetto
I use Perfetto tracing to get a good picture of the system-level & high-level app behavior. The Android Quickstart is a bit overwhelming, here's what I do:
# Prepare the device
adb root
adb shell setprop persist.traced.enable 1

# Download the record_android_trace script
curl -O https://raw.githubusercontent.com/google/perfetto/master/tools/record_android_trace
chmod u+x record_android_trace

# Capture a trace for com.example.myapp
./record_android_trace -o trace_file.perfetto-trace -b 500mb \
-a com.example.myapp sched freq idle am wm gfx view \
binder_driver hal dalvik camera input res

Trace started. Press CTRL+C to stop
I perform the interaction I'm profiling, then I press CTRL+C and the script automatically opens ui.perfetto.dev with a new trace.
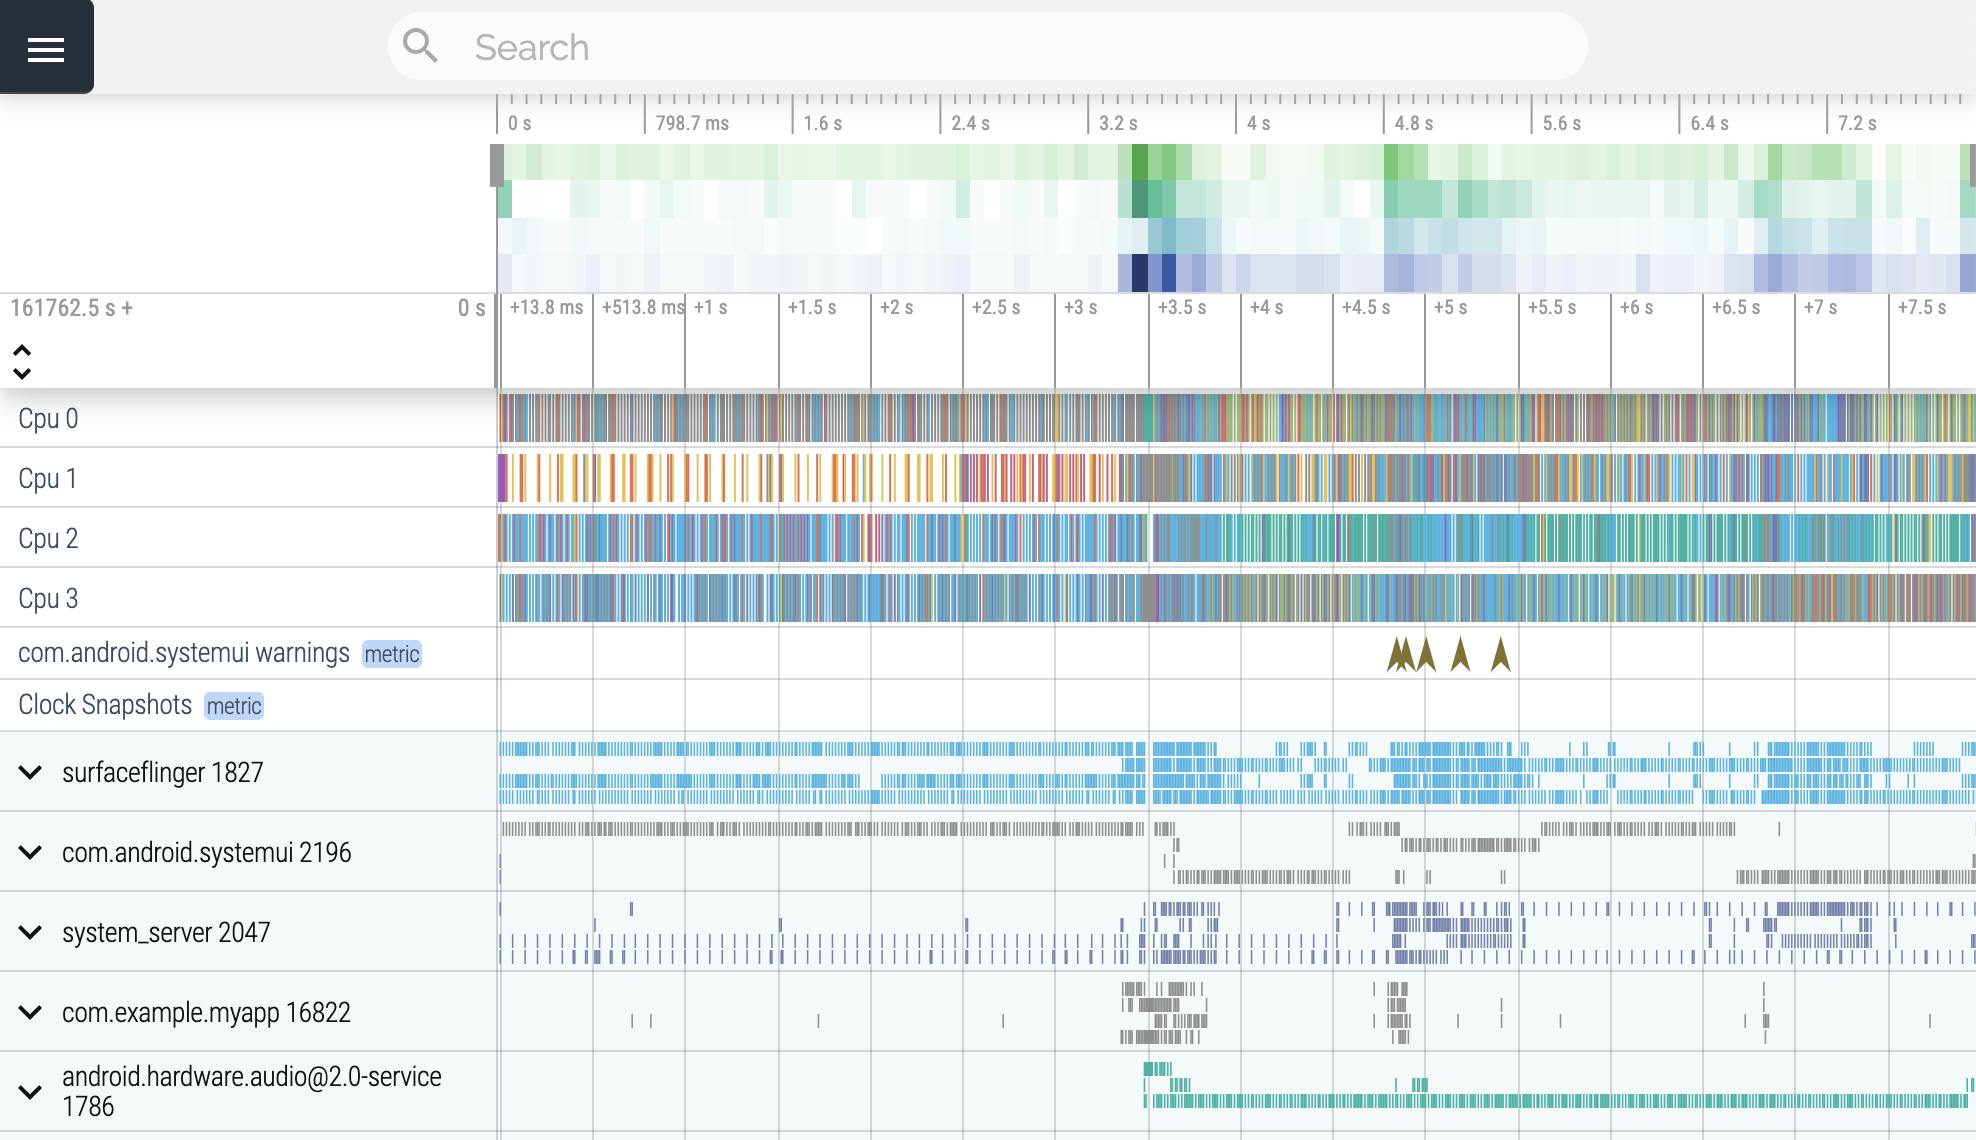
Perfetto shows a lot of information! If you're lost, press ? to bring up the navigation help, and learn that you can move around the timeline with the WASD keys. Then open up the row with your app's package name to see its list of threads.
Here the main thread is shown on the first 2 rows (named after the app package name, com.example.myapp), and the render thread on the second 2 rows. For each thread, we see thread states (running, etc) in the first row, and then the system traces in the following row.
BALEETED!
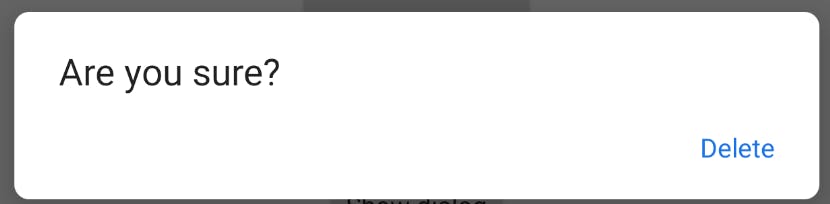
Let's look at an example, a delete button that shows a confirm dialog.
findViewById<Button>(R.id.delete).setOnClickListener {
  AlertDialog.Builder(this)
    .setTitle("Are you sure?")
    .setPositiveButton("Delete") { _, _ ->
      delete()
      Toast.makeText(this@MainActivity, "BALEETED!", LENGTH_SHORT).show()
    }
    .show()
}
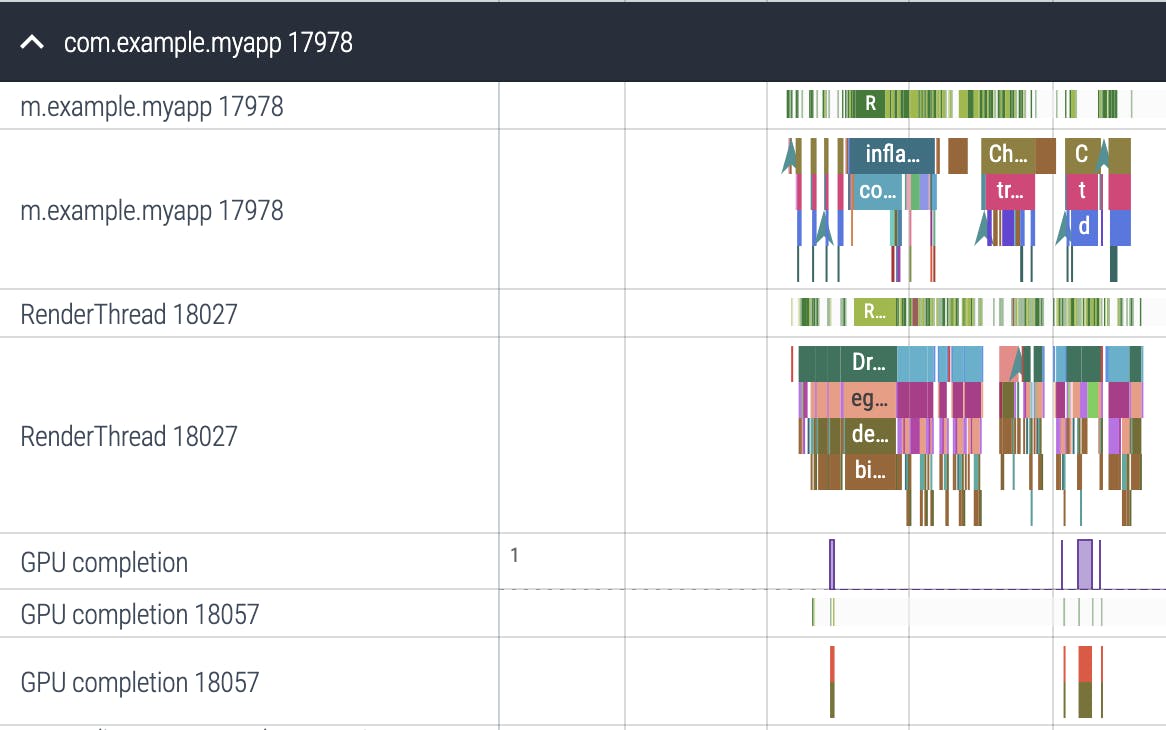
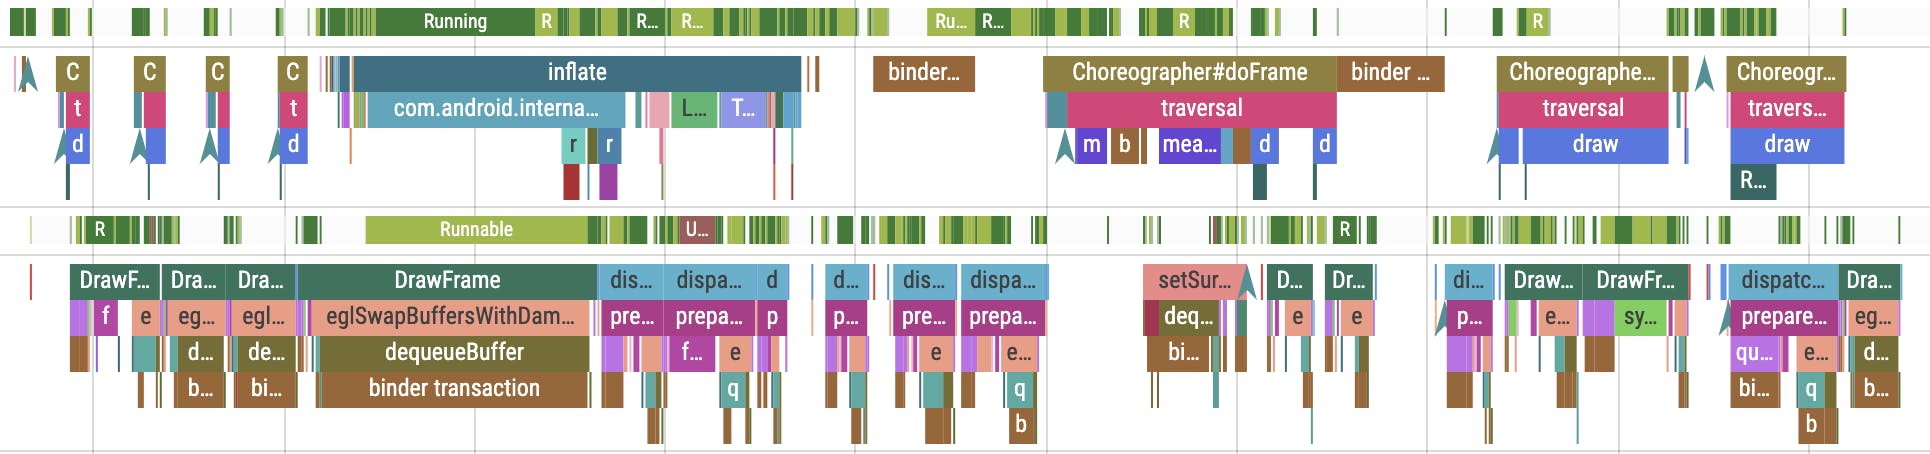
After recording a trace, this is what we see in Perfetto when the dialog is shown:
And then when the user confirms deletion, the dialog is dismissed and the toast is shown:
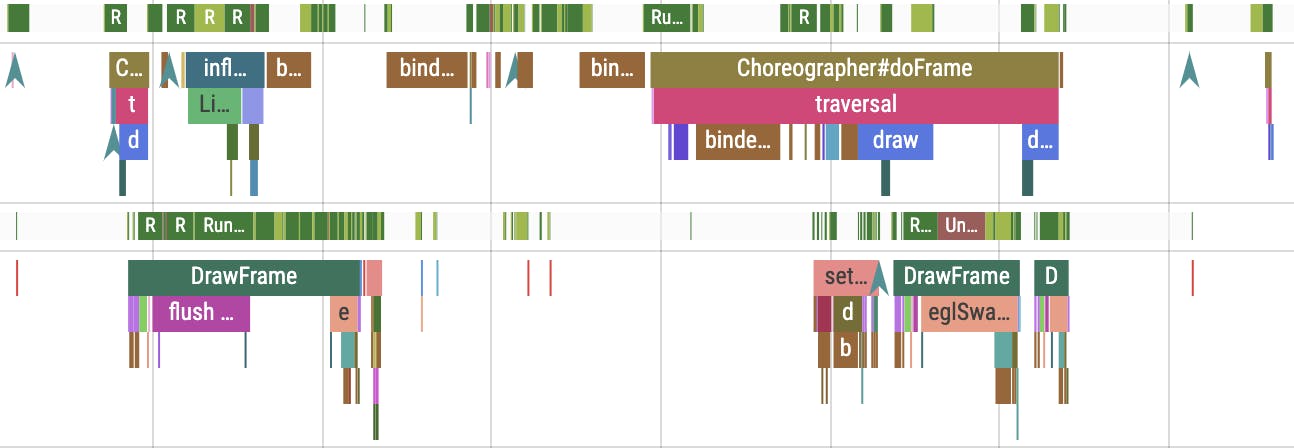
We can tell that view inflation is happening, followed by a Choreographer frame. But it's hard to grasp a good understanding of the details, as well as what happens during the gaps in between. Is there any way we can add more details?
Looper logging
As I wrote in 2013 in A journey on the Android Main Thread, the main thread has a dedicated Looper which is in charge of looping, i.e. running main thread messages serially forever.
Looper also has a seldom-used logging API: Looper.setMessageLogging():
Control logging of messages as they are processed by this Looper. If enabled, a log message will be sent to the logger at the beginning and end of each message dispatch, identifying the target Handler and message contents.
We can use it to log the messages that run on the main thread:
class ExampleApplication : Application() {

  override fun onCreate() {
    super.onCreate()

    Looper.getMainLooper().setMessageLogging { log ->
      Log.d("ExampleApplication", log)
    }
  }
}
For each message posted to the main thread, we get a log before the message runs and a log after:
D ExampleApplication: >>>>> Dispatching to Handler (android.view.View
  RootImpl$ViewRootHandler) {c93a855} android.view.View$PerformClick
  @a6c9a1a: 0

D ExampleApplication: <<<<< Finished to Handler (android.view.ViewRoot
  Impl$ViewRootHandler) {c93a855} android.view.View$PerformClick
  @a6c9a1a
Main thread message trace sections
We can leverage the Looper logging APIs to add a trace section for each main thread message. First, we add the AndroidX tracing library:
dependencies {
  implementation "androidx.tracing:tracing-ktx:1.0.0"
}
Then we can use the >>>>> / <<<<< suffix in the message to determine if the log marks the start or the end of a main thread message, and delegate to androidx.tracing.Trace accordingly:
class ExampleApplication : Application() {

  override fun onCreate() {
    super.onCreate()
    Looper.getMainLooper().setMessageLogging { log ->
      if (log.startsWith('>')) {
        Trace.beginSection(log)
      } else if (log.startsWith('<')) {
        Trace.endSection()
      }
    }
  }
}
Unfortunately, this eventually crashes:
Process: com.example.myapp, PID: 15870
java.lang.IllegalArgumentException: sectionName is too long
    at android.os.Trace.beginSection(Trace.java:333)
    at androidx.tracing.TraceApi18Impl.beginSection(TraceApi18Impl.java:49)
    at androidx.tracing.Trace.beginSection(Trace.java:81)
    at com.example.myapp.ExampleApplication$onCreate$1.println(ExampleApplication.kt:29)
    at android.os.Looper.loop(Looper.java:183)
    at android.app.ActivityThread.main(ActivityThread.java:7356)
    at java.lang.reflect.Method.invoke(Native Method)
    at com.android.internal.os.RuntimeInit$MethodAndArgsCaller.run(RuntimeInit.java:492)
    at com.android.internal.os.ZygoteInit.main(ZygoteInit.java:930)
The AndroidX Trace.beginSection() javadoc is leaving out a crucial detail from the AOSP Trace.beginSection() javadoc:
sectionName may be at most 127 Unicode code units long.
Let's fix the crash:
class ExampleApplication : Application() {

  override fun onCreate() {
    super.onCreate()
    Looper.getMainLooper().setMessageLogging { log ->
      if (log.startsWith('>')) {
        // Would be nice if AndroidX automatically truncated to 127
        Trace.beginSection(log.take(127))
      } else if (log.startsWith('<')) {
        Trace.endSection()
      }
    }
  }
}
Let's look at how the trace changes:
Before

After
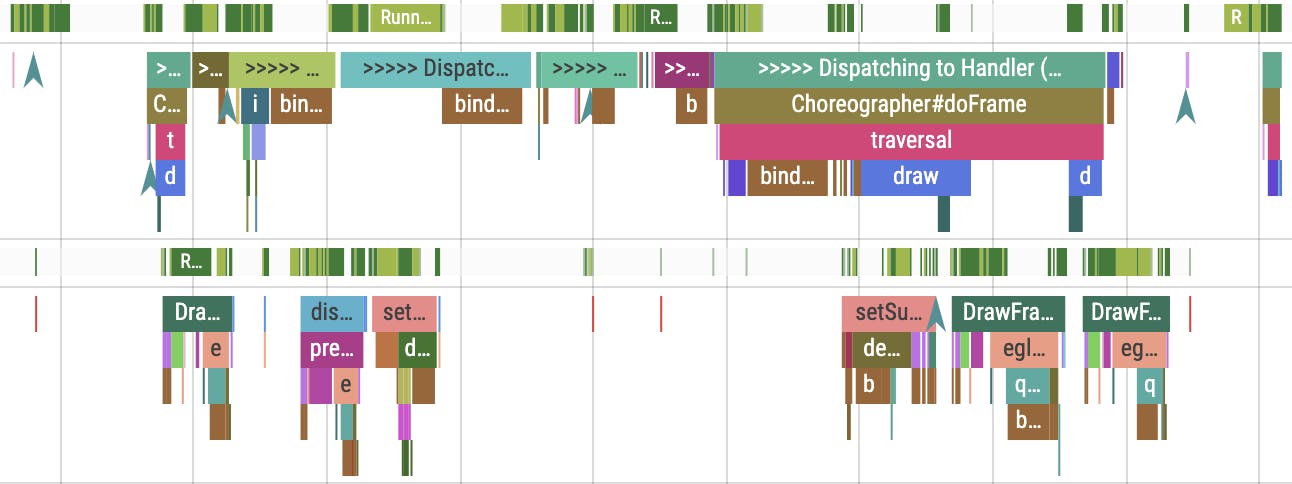
The result is useful, we have a lot less empty space and we know what work belongs to the same main thread message. However, every single section starts with >>>>> Dispatching to. The most useful information is the callback class name, but it's appending at the end of the string so the 127 character limit means the callback class name is often truncated.
Better section names
Let's look at how Looper assembles the log:
    private boolean loopOnce() {
        Message msg = mQueue.next();

        Printer logging = mLogging;
        if (logging != null) {
            logging.println(">>>>> Dispatching to " + msg.target + " "
                    + msg.callback + ": " + msg.what);
        }
The format for that string hasn't changed since the AOSP import commit in 2008. Let's parse the log string back into its components:
val logNoPrefix = log.removePrefix(">>>>> Dispatching to ")
val indexOfWhat = logNoPrefix.lastIndexOf(": ")
val indexOfCallback = logNoPrefix.indexOf("} ")

val targetHandler = logNoPrefix.substring(0, indexOfCallback + 1)
val callback = logNoPrefix.substring(indexOfCallback + 2, indexOfWhat)
val what = logNoPrefix.substring(indexOfWhat + 2)
callback is the result of calling callback.toString() on the Runnable passed to Handler.post(), which most of the time returns the default Object.toString() implementations. Coroutine continuations override toString() to provide useful information about the callsite, but add a lengthy prefix so let's get rid of that:
val callback = logNoPrefix.substring(indexOfCallback + 2, indexOfWhat)
  .removePrefix("DispatchedContinuation[Dispatchers.Main, Continuation at ")
  .removePrefix("DispatchedContinuation[Dispatchers.Main.immediate, Continuation at ")
We can then reassemble the values into a better section label that puts the callback first:
private fun buildSectionLabel(log: String): String {
  val logNoPrefix = log.removePrefix(">>>>> Dispatching to ")
  val indexOfWhat = logNoPrefix.lastIndexOf(": ")
  val indexOfCallback = logNoPrefix.indexOf("} ")

  val targetHandler = logNoPrefix.substring(0, indexOfCallback + 1)
  val callback = logNoPrefix.substring(indexOfCallback + 2, indexOfWhat)
    .removePrefix("DispatchedContinuation[Dispatchers.Main, Continuation at ")
    .removePrefix("DispatchedContinuation[Dispatchers.Main.immediate, Continuation at ")
  val what = logNoPrefix.substring(indexOfWhat + 2)

  return if (callback != "null") {
    "$callback $targetHandler $what"
  } else {
    "$targetHandler $what"
  }
}
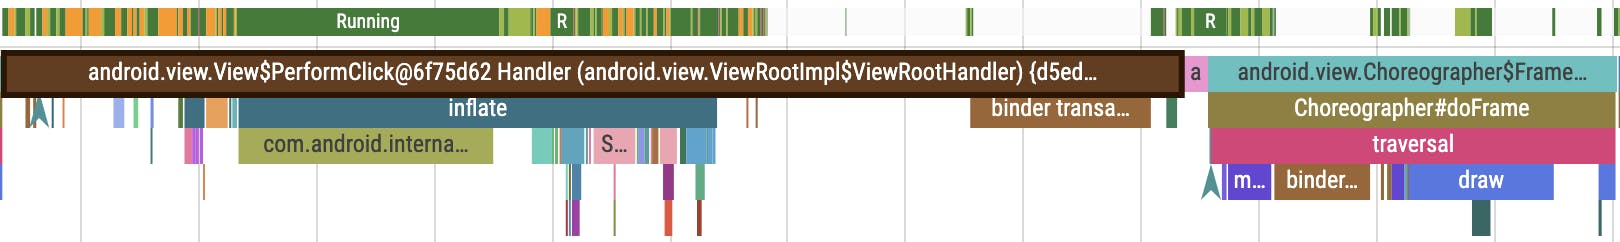
Now we clearly see the class name of callbacks posted to the main thread, e.g. View$PerformClick:
Cost of logging
This hack is really cool, but it also leads to the app doing extra string concatenation for every main thread message. We should only do this when we want to profile the app, e.g. by adding a runtime check.
Edit: as Chris Craik and John Reck reminded me (thanks!), we should also skip calling buildSectionLabel() when not actively tracing by checking Trace.isEnabled():
val debuggable = (applicationInfo.flags and ApplicationInfo.FLAG_DEBUGGABLE) != 0
val profileable = Build.VERSION.SDK_INT >= 29 && applicationInfo.isProfileableByShell

if (debuggable || profileable) {
  Looper.getMainLooper().setMessageLogging { log ->
    if (!Trace.isEnabled()) {
      return@setMessageLogging
    }
    if (log.startsWith('>')) {
      val label = buildSectionLabel(log)
      Trace.beginSection(label.take(127))
    } else if (log.startsWith('<')) {
      Trace.endSection()
    }
  }
}
Pooled lambda crash
If you run this code on Android 9, you will eventually run into a crash. The AOSP codebase supports lambdas and method references but uses recyclable anonymous functions via PooledLambda to avoid creating an extra instance for every lambda (example). It's a neat optimization!
When Looper concatenates the log string, it calls callback.toString(), and that callback might be a PooledLambda. Unfortunately, on Android 9 calling toString() on a lambda with 0 argument would throw an exception, which was fixed in Android 10.
There's no work around, we can't even catch the exception, the only fix is to disable our message tracing for Android 9 / API 28.
All together
This is the final code with everything put together. If you improve upon it, feel free to let me know on Twitter. Happy profiling!
package com.example.myapp

import android.app.Application
import android.content.pm.ApplicationInfo
import android.os.Build
import android.os.Looper
import androidx.tracing.Trace

class ExampleApplication : Application() {

  override fun onCreate() {
    super.onCreate()

    val debuggable = (applicationInfo.flags and ApplicationInfo.FLAG_DEBUGGABLE) != 0
    val profileable = Build.VERSION.SDK_INT >= 29 && applicationInfo.isProfileableByShell

    if (Build.VERSION.SDK_INT != 28 && (debuggable || profileable)) {
      Looper.getMainLooper().setMessageLogging { log ->
        if (!Trace.isEnabled()) {
          return@setMessageLogging
        }
        if (log.startsWith('>')) {
          val label = buildSectionLabel(log)
          Trace.beginSection(label.take(127))
        } else if (log.startsWith('<')) {
          Trace.endSection()
        }
      }
    }
  }

  private fun buildSectionLabel(log: String): String {
    val logNoPrefix = log.removePrefix(">>>>> Dispatching to ")
    val indexOfWhat = logNoPrefix.lastIndexOf(": ")
    val indexOfCallback = logNoPrefix.indexOf("} ")

    val targetHandler = logNoPrefix.substring(0, indexOfCallback + 1)
    val callback = logNoPrefix.substring(indexOfCallback + 2, indexOfWhat)
      .removePrefix("DispatchedContinuation[Dispatchers.Main, Continuation at ")
      .removePrefix("DispatchedContinuation[Dispatchers.Main.immediate, Continuation at ")
    val what = logNoPrefix.substring(indexOfWhat + 2)

    return if (callback != "null") {
      "$callback $targetHandler $what"
    } else {
      "$targetHandler $what"
    }
  }
}
Cover image: Lost at Sea by Romain Guy.