


Of sharks and heaps of sticky marshmallows
A deep dive into GC roots in Android M heap dumps


👋 Hi, this is P.Y., I work as an Android Distinguished Engineer at Block, the rockey company formerly known as Square. I spend a lot of time focusing on performance and try to share my experience with deep-dive blog posts. I hope you like this one, let me know on Twitter!
Introduction
At Square, we run LeakCanary in CI after every UI test thanks to the DetectLeaksAfterTestSuccess test rule:
class CartTest {
  @get:Rule
  val rules = RuleChain.outerRule(DetectLeaksAfterTestSuccess())
    .around(ActivityScenarioRule(CartActivity::class.java))

  @Test
  fun addItemToCart() {
    // ...
  }
}
Last week a colleague noticed that our Android CI heap analysis occasionally took several minutes. This blog is a deep dive based on my notes from the investigation!
GC Roots
We realize this is happening only on API 23 emulators (API 23 is Android 6, aka Android Marshmallow), and we can reproduce the issue locally. I add trace sections and hook up Perfetto while the test is running:

I immediately notice something weird: the heap size increases more than expected when LeakCanary starts its analysis. Could that be somehow related to the slow down?
I capture a heap dump while the heap analysis is running and look at instance counts sorted by total shallow size in YourKit Java Profiler:
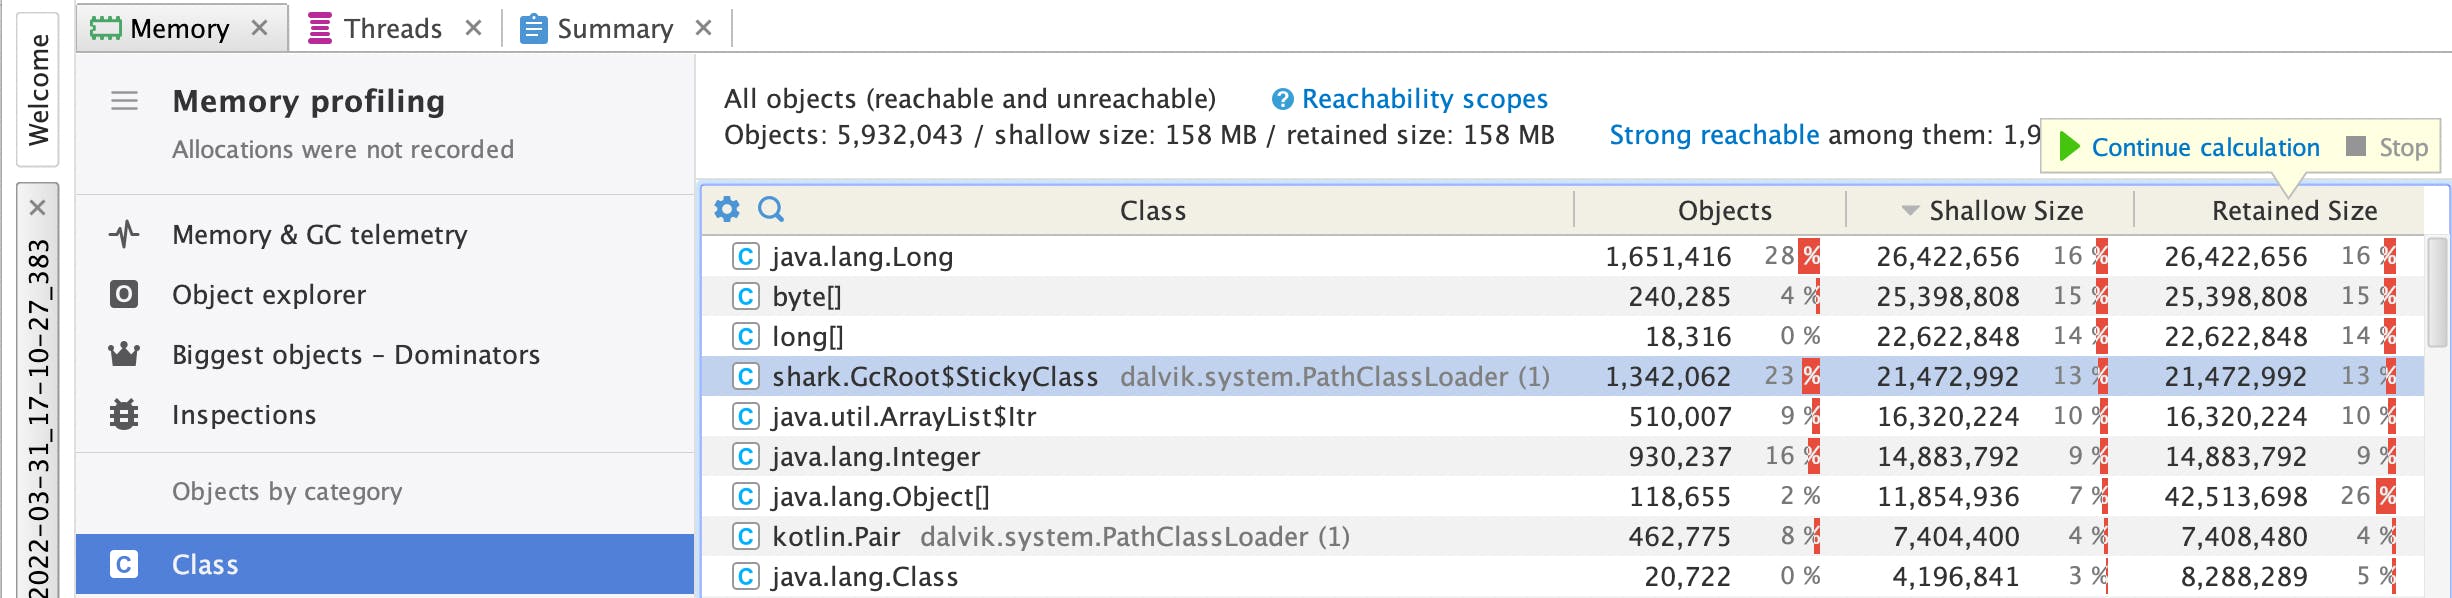
The 4th entry is surprising: 1.3M instances of GcRoot.StickyClass. This class is a part of Shark, LeakCanary's heap dump parser. Here's how the YourKit doc describes GC roots:
The so-called GC (Garbage Collector) roots are objects special for garbage collector. Garbage collector collects those objects that are not GC roots and are not accessible by references from GC roots.
There are several kinds of GC roots. One object can belong to more than one kind of root. The root kinds are:
- Class - class loaded by system class loader. Such classes can never be unloaded. They can hold objects via static fields.
- ...
Classes loaded by the system class loader are never garbage collected, so they stick around, and are therefore known as sticky classes. In a JVM, custom classes can be loaded and then unloaded, but on Android, they're never unloaded. So any loaded class stays in memory forever and acts as a GC root that holds static field references forever.
Shark parses a heap dump and keeps the list of all GC roots in memory, and that's usually a reasonably small list. 1.3M sticky class GC roots is not expected!
Shark
I decide to write ad hoc code with Shark to analyze an API 23 heap dump more systematically and compute aggregates. Let's start by printing the counts of GC Root by type:
// openHeapGraph() parses the heap dump file content
heapDumpFile.openHeapGraph().use { graph ->
  // Grab all GC roots
  val roots = graph.gcRoots
  // Create a map of GC root type => count of that type
  val counts = roots.countBy { it.javaClass }
  // Turn the map into a list of entries, sorted by the counts.
  val sortedCounts = counts.entries.sortedBy { -it.value }
  println(counts.joinToString("\n"))
}
class shark.GcRoot$StickyClass=1342062
class shark.GcRoot$JavaFrame=807
class shark.GcRoot$JniGlobal=402
class shark.GcRoot$ThreadObject=56
class shark.GcRoot$JniLocal=54
class shark.GcRoot$NativeStack=53
As expected, we see 1.3M StickyClass GC roots. Other types of GC roots have reasonable counts. Do we have 1.3M classes, though?
heapDumpFile.openHeapGraph().use { graph ->
  println("class count=${graph.classes.count()}")
}
class count=52940
Okay, how do we go from 53K classes to 1.3M sticky class GC roots?
class StickyClass(override val id: Long) : GcRoot()
A sticky class GC root is solely defined by the id of the root object, so let's see if we have duplicate ids, and what objects these ids correspond to:
heapDumpFile.openHeapGraph().use { graph ->
  // Grab all GC roots
  val roots = graph.gcRoots
  // Keey only sticky class gc roots
  val stickyRoots = roots.filterIsInstance(StickyClass::class.java)
  // Create a map of id => count of that id in the stickyRoots list
  val stickyCounts = stickyRoots.countBy { it.id }
  // Turn the map into a list of entries, sorted by the counts.
  val sortedStickyCounts = stickyCounts.entries.sortedBy { it.value }

  // Map the id to the actual object it references join into a string
  val result = sortedStickyCounts.joinToString("\n") {
    "${graph.findObjectById(it.key)}: ${it.value}"
  }
  println(result)
}
...
object array @318259200 of java.lang.Class[]: 27182
primitive array @-1970475008 of int[]: 27235
object array @325763072 of java.lang.Class[]: 27235
primitive array @-1966432256 of int[]: 28152
object array @319406080 of java.lang.Class[]: 28152
primitive array @1879291968 of int[]: 28261
object array @1879261584 of java.lang.Class[]: 28261
primitive array @-1966821376 of int[]: 30331
object array @319721472 of java.lang.Class[]: 30331
What?! primitive array, object array.. these aren't classes! There are 53001 distinct object ids referenced by sticky class GC roots, out of which 52939 point to classes and 62 point to int and object arrays.
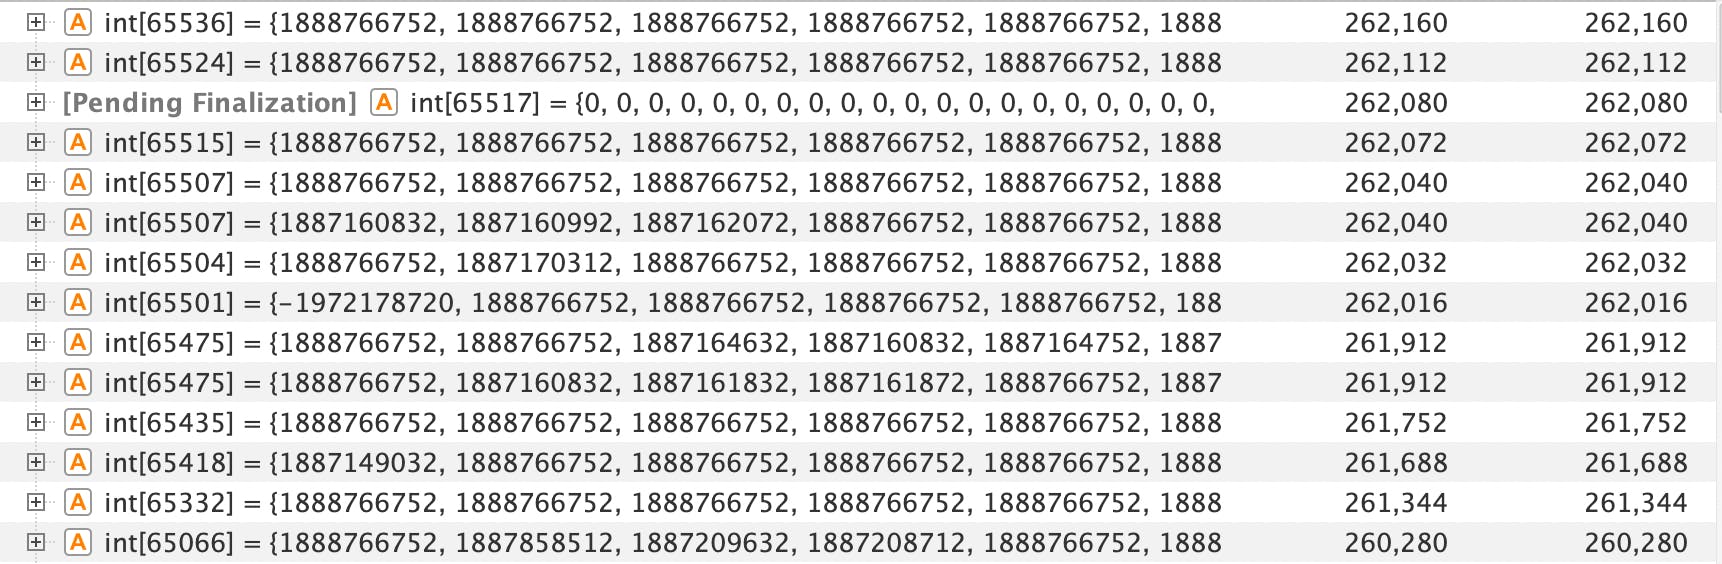
Interestingly, these int arrays have a size very close to 65K. Notice the size of the top one: 65536. You might have seen that number before... in the multidex documentation:
The Dalvik Executable specification limits the total number of methods that can be referenced within a single DEX file to 65,536.
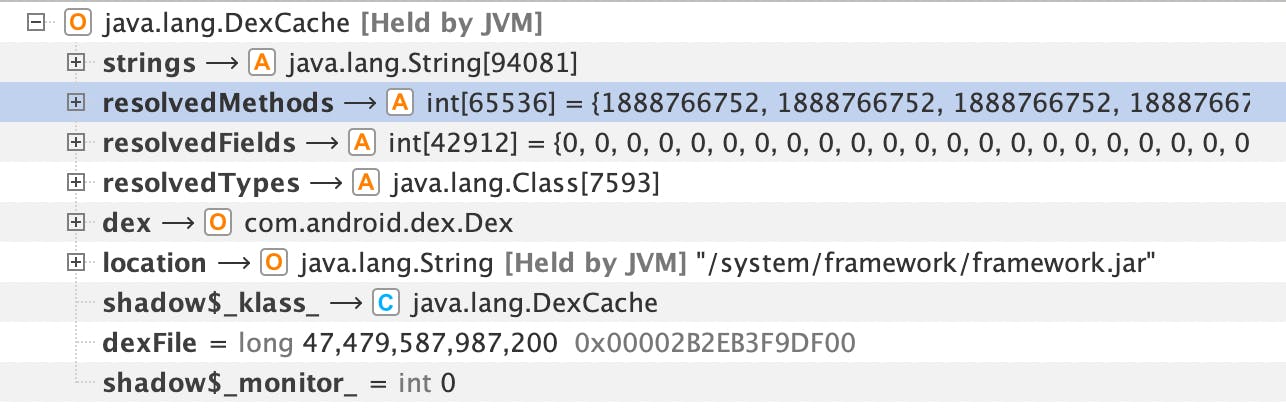
These non-class objects that sticky class GC roots are pointing to are objects referenced by DexCache.resolvedMethods, DexCache.resolvedFields and DexCache.resolvedTypes.
That's a little weird but ok. We still don't know why we have all the duplicated GC roots. From what I gather, the class table was maintained by class_linker.cc in Android M and apparently that changed in Android N, which seemingly fixed bugs related to visiting the same class roots over and over again.
Bugfix
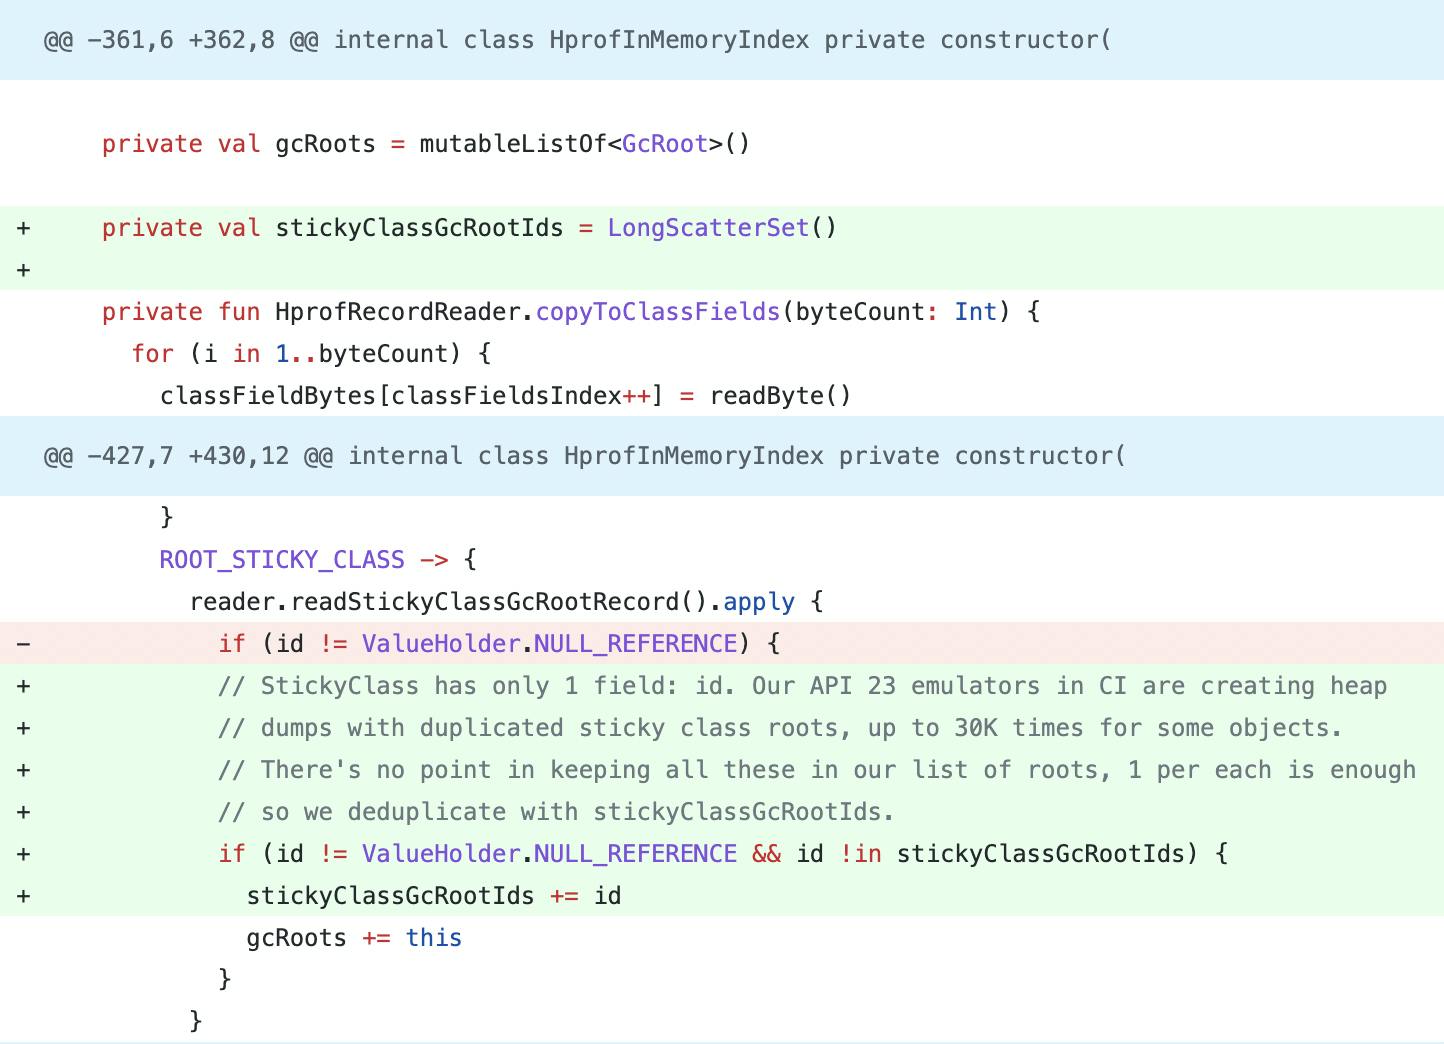
I can quickly fix the increased memory usage in LeakCanary (PR) by introducing a set to ignore repeated sticky class entries:
Let's not forget to add a unit test:
@Test fun `duplicated StickyClass GC roots are deduplicated`() {
  val className = StringRecord(id, "com.example.VeryStickyClass")
  val loadClassRecord = LoadClassRecord(1, id, 1, className.id)
  val classDump = ClassDumpRecord(
    id = loadClassRecord.id,
    stackTraceSerialNumber = 1,
    superclassId = 0,
    classLoaderId = 0,
    signersId = 0,
    protectionDomainId = 0,
    instanceSize = 0,
    staticFields = emptyList(),
    fields = emptyList()
  )
  val stickyClassRecords = (1..5).map {
    GcRootRecord(StickyClass(loadClassRecord.id))
  }
  val hprofRecords = listOf(className, loadClassRecord, classDump) +
    stickyClassRecords
  val bytes = hprofRecords.asHprofBytes()

  val stickyClassRoots = bytes.openHeapGraph().use { graph ->
    graph.gcRoots.filterIsInstance(StickyClass::class.java)
  }

  assertThat(stickyClassRoots).hasSize(1)
  val stickyClassRoot = stickyClassRoots.first()
  assertThat(stickyClassRoot.id).isEqualTo(loadClassRecord.id)
}
Conclusion
I capture a perfetto trace running the same analysis before and after the change:
Before

After

🎉 Heap consumption is halved from max 260Mb to max 140Mb!
You know what, though? Our heap analysis in CI is still super slow on API 23. Something else is going on! Wouldn't that be a great follow-up article?
Cover image: Jelly Fish On Blue by Romain Guy.